Tutorial 1: Introduction to Remote Sensing
Contents
Tutorial 1: Introduction to Remote Sensing#
Week 1, Day 3, Remote Sensing
Content creators: Douglas Rao
Content reviewers: Dionessa Biton, Katrina Dobson, Younkap Nina Duplex, Maria Gonzalez, Will Gregory, Nahid Hasan, Sherry Mi, Beatriz Cosenza Muralles, Jenna Pearson, Chi Zhang, Ohad Zivan
Content editors: Jenna Pearson, Chi Zhang, Ohad Zivan
Production editors: Wesley Banfield, Jenna Pearson, Chi Zhang, Ohad Zivan
Our 2023 Sponsors: NASA TOPS and Google DeepMind
Tutorial Objectives#
Today you will learn the basics of remote sensing, how to find remote sensing data, and how to use it for studying the climate across 8 tutorials.
The first tutorial introduces the fundamental concepts of remote sensing technologies and data. Although you won’t be doing any coding in this initial module, some compelling examples of how remote sensing data can be utilized to monitor our environment and society’s diverse facets will be illustrated.
By the end of this tutorial, you’ll be able to:
Grasp key concepts of satellite remote sensing, including the electromagnetic spectrum, satellite orbits, and resolutions.
Appreciate the value and benefits of satellite remote sensing for climate studies through selected examples.
Video 1: What is Remote Sensing#
# @title Video 1: What is Remote Sensing
# Tech team will add code to format and display the video
Section 1: What is Remote Sensing?#
Remote sensing is the technique of getting information from a distance (remotely). In daily life, photography is a very common format of remote sensing. In Earth and environmental science, sensors are often used on satellites in space or aircrafts in the sky to acquire information on topics such as agriculture, disaster response, and air pollution.
There are many organizations involved in this work, including government agencies like NASA and NOAA, private companies like Planet and Maxar, and various universities. They design and launch remote sensors on satellites and aircraft to monitor natural and human environments.
These remote sensors offer a unique perspective of Earth and enable data-informed decision making about our planet’s present and future state. For an example of the data these sensors can provide, this is the Visible Infrared Imager Radiometer Suite (VIIRS) onboard the Suomi-NPP satellite launched in 2011. The image below is the first global image it captured on November 28, 2011.
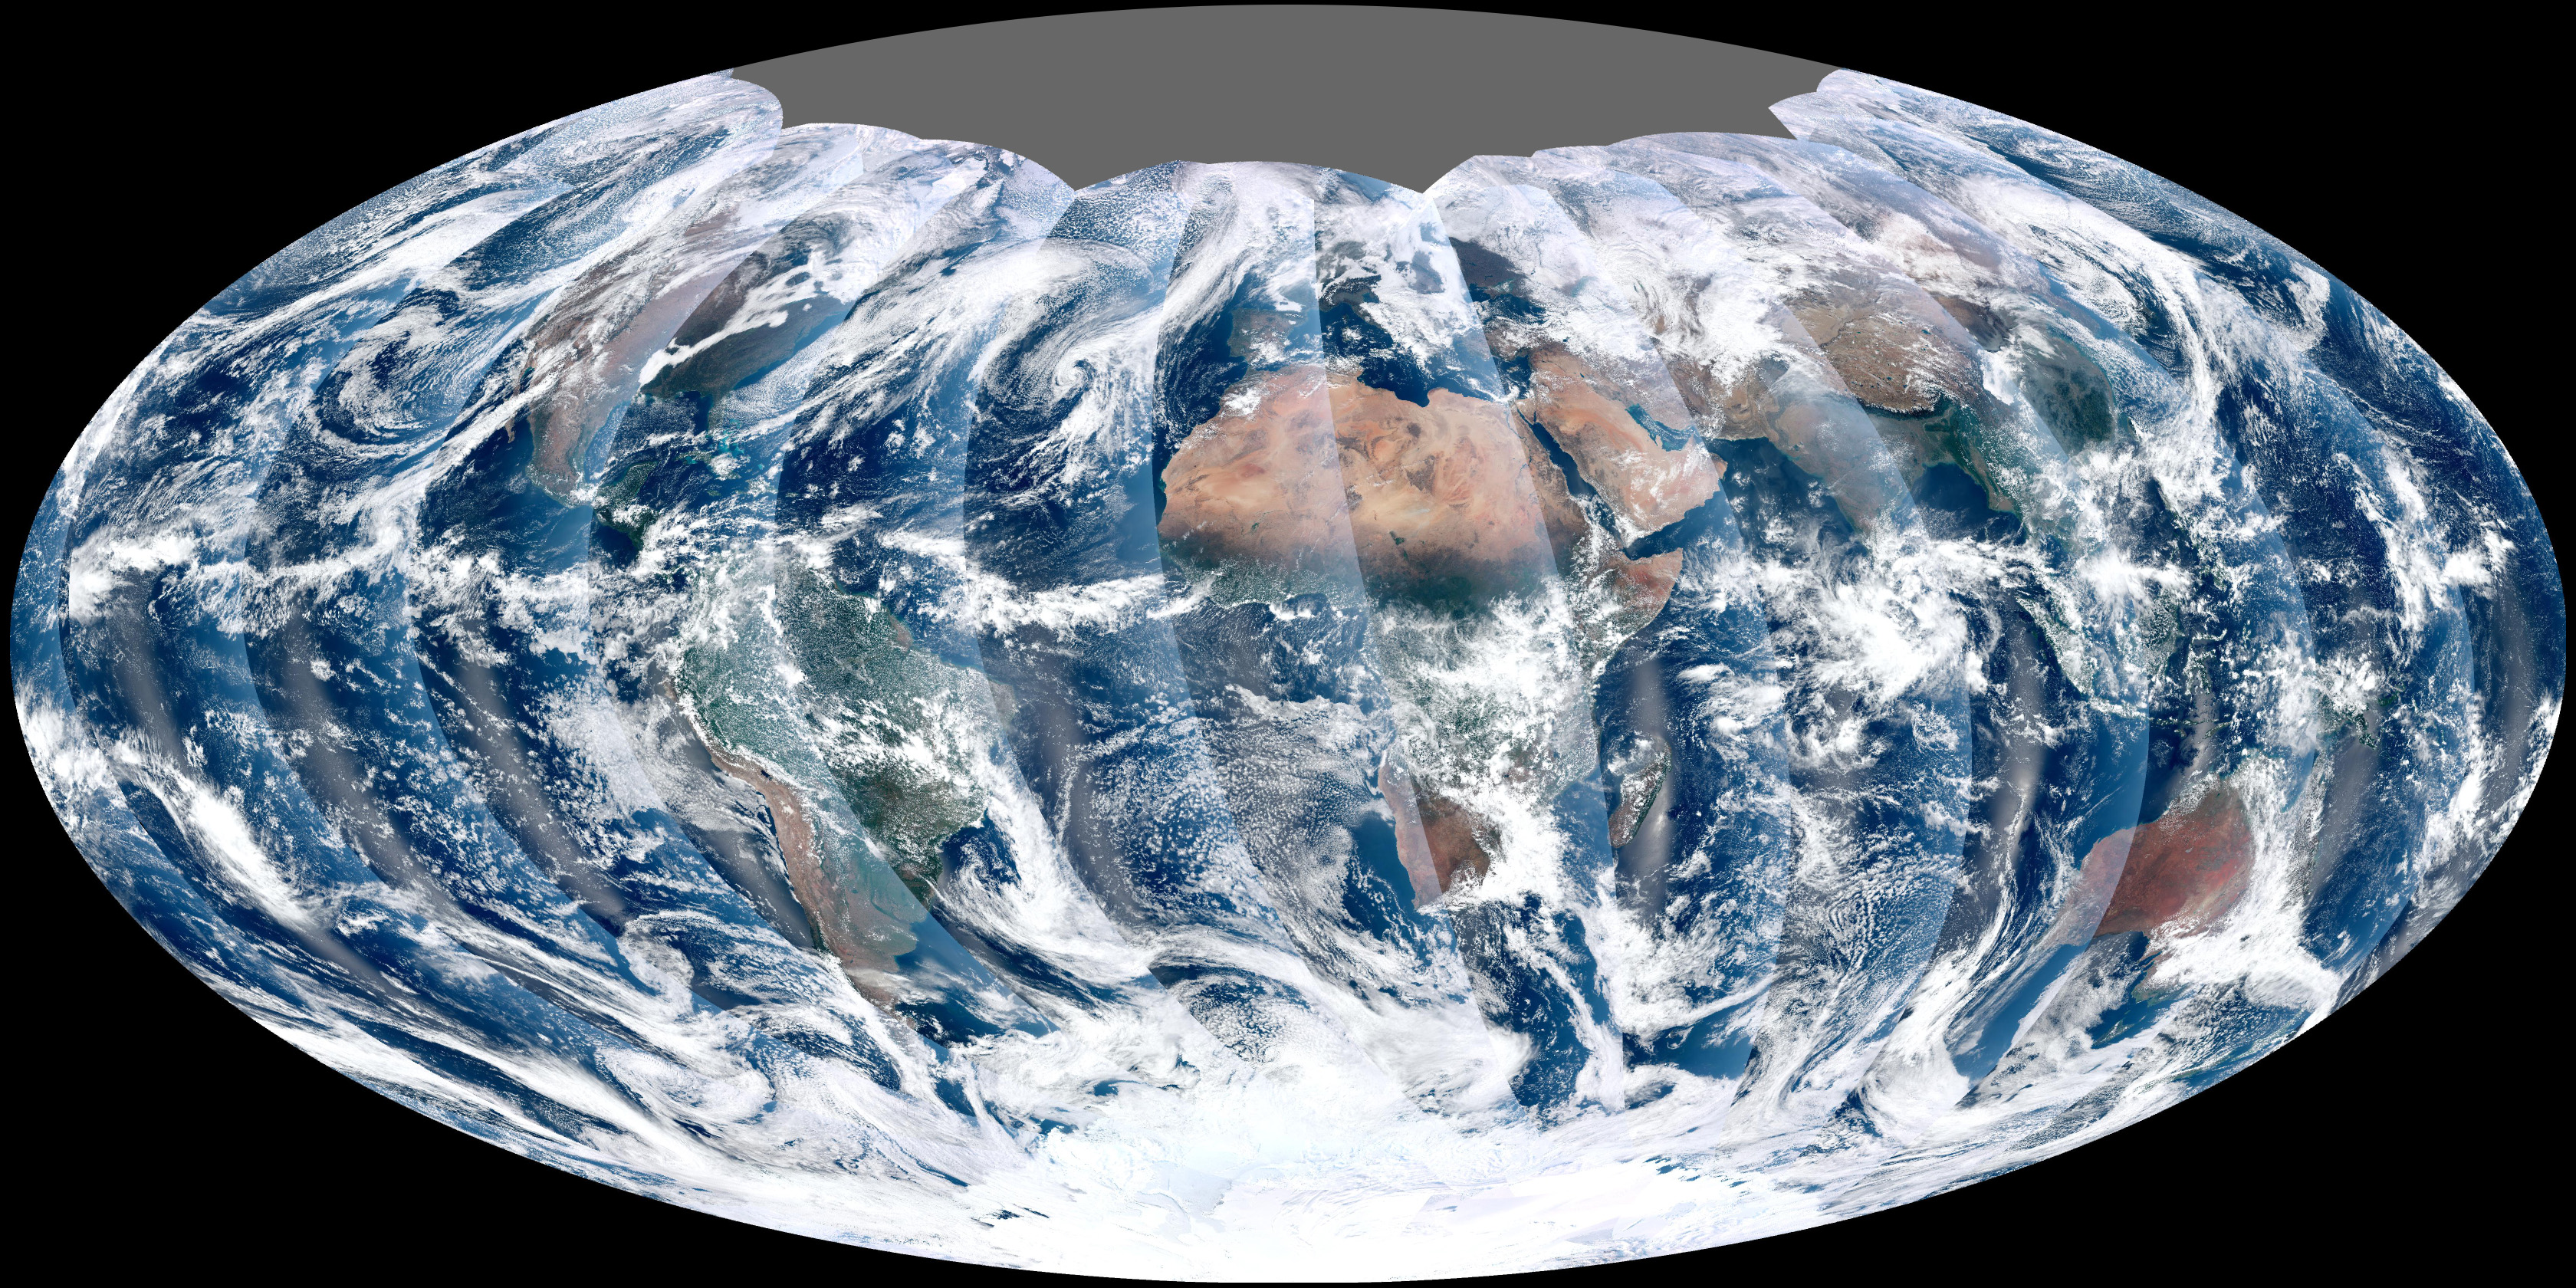 The first global composite of data captured by VIIRS on November 28, 2011. (Credit: NASA Earth Observatory)
Section 1.1: Electromagnetic Spectrum#
The concept of the electromagnetic spectrum is at the core of remote sensing.
Electromagnetic energy, radiated or reflected by objects, travels as waves through the atmosphere and the void of space. These waves exhibit different wavelengths (the distance between successive wave crests) and frequencies; a shorter wavelength corresponds to a higher frequency. Certain waves, like radio, microwave, and infrared, possess longer wavelengths, whereas others, such as ultraviolet, x-rays, and gamma rays, possess much shorter wavelengths.
Humans can only perceive visible light, situated in the middle of the spectrum that spans from longwave to shortwave radiation.
Nonetheless, we can engineer sensors to capture all other forms of electromagnetic energy emitted or reflected by elements of the Earth system, enabling us to monitor and research the Earth system.
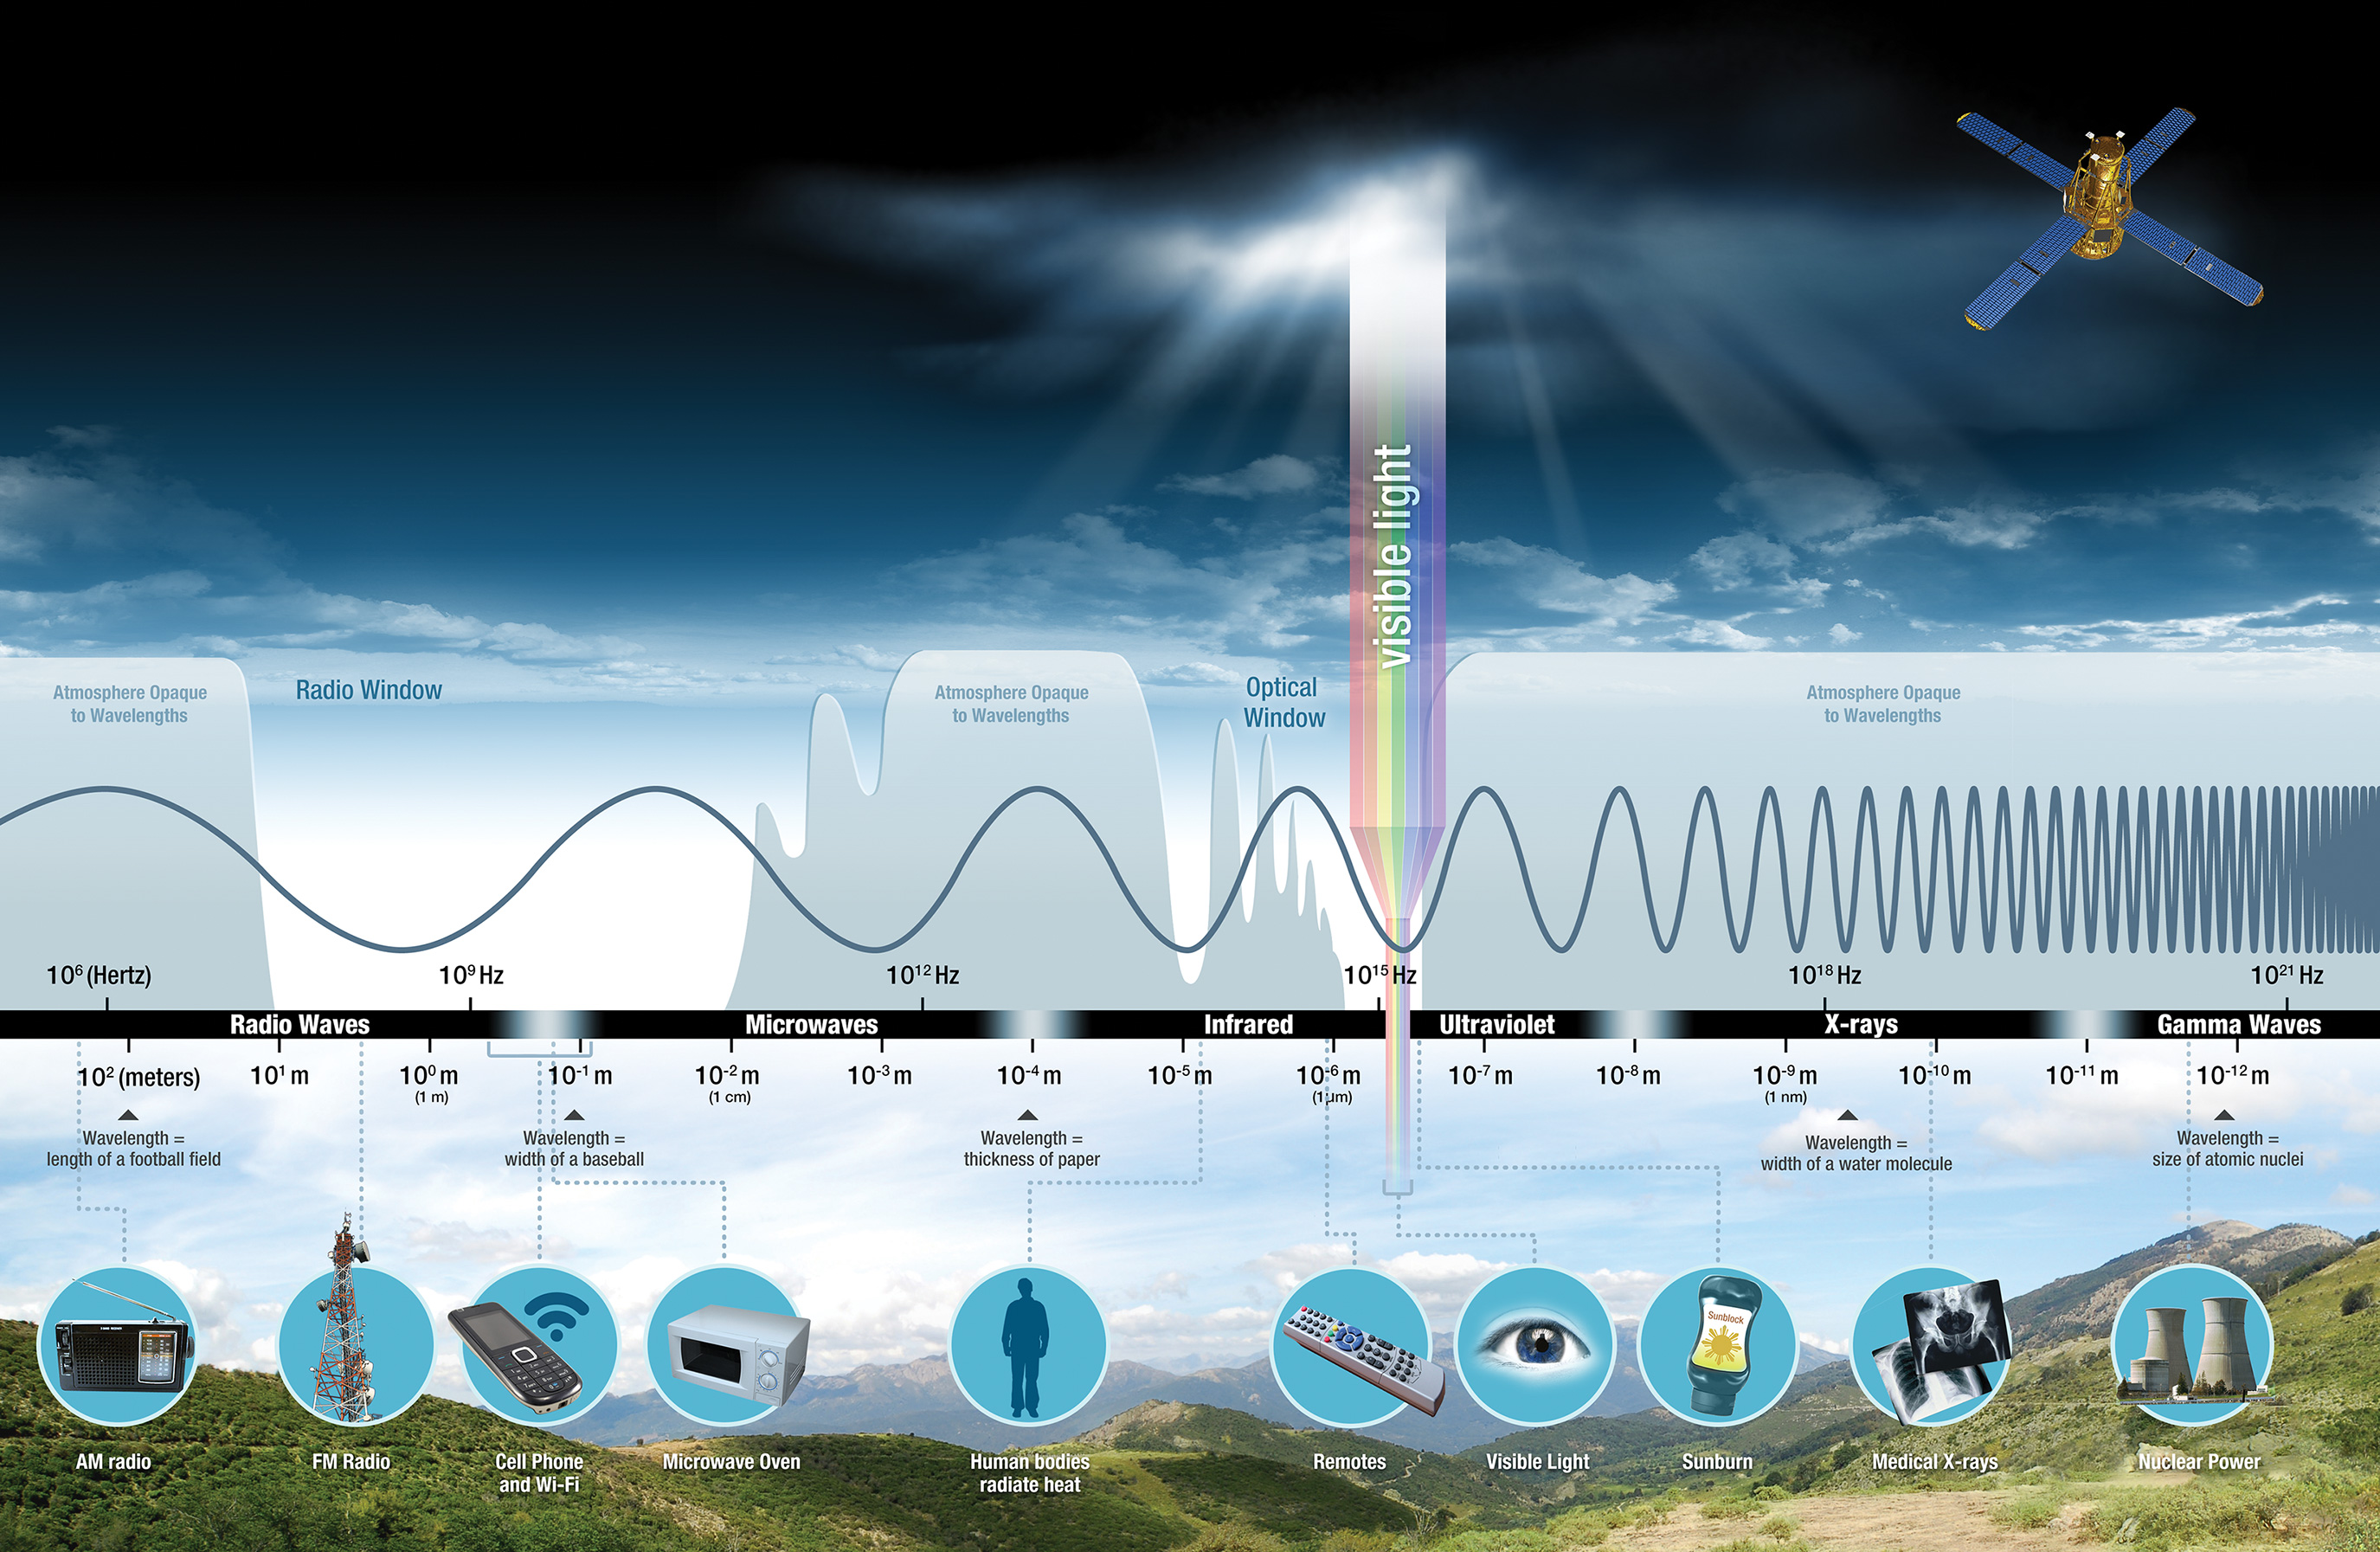 Diagram of the Electromagnetic Spectrum. (Credit: NASA Science)
What is the connection between the electromagnetic spectrum and the study and monitoring of Earth?
Every element of Earth’s system—land, water, air, and life—interacts with energy differently, reflecting, absorbing, or transmitting varying amounts depending on the wavelength. These energy interactions can be captured by strategically designed remote sensors, allowing us to analyze and understand these components.
For instance,
Snow possesses a high albedo, reflecting up to 90% of incoming solar radiation in the visible light wavelength. This high reflectivity accounts for snow’s bright, white appearance to the human eye.
Conversely, the ocean reflects only about 6% of incoming solar radiation, absorbing the remainder. This absorption makes the ocean appear darker, though its appearance can be influenced by other factors like surface waves, phytoplankton presence, and water quality.
When solar energy is absorbed, it is typically re-emitted at longer wavelengths, such as infrared and thermal infrared. Thus, the ocean commonly re-emits absorbed solar energy as infrared radiation, which is utilized to monitor ocean temperatures. These are processes we experience in our everyday life, even if we don’t consciously recognize them. Have you ever wondered why most leaves are green, why the sky is blue, or why flowers come in such a variety of colors?
The answers to these questions assist scientists in developing sensors to monitor vegetation health, air and water quality, detect wildfires, and many other crucial applications.
Want to learn more about electromagnetic spectrum? Take a tour of the electromagnetic spectrum with NASA Science!
Section 1.2: Satellite Orbits#
Satellites can occupy several types of orbits around Earth. The three common categories of orbits are:
Low-Earth orbit (approximately 160 to 2,000 km above Earth): This orbit is common for many Earth-observing satellites, including polar-orbiting satellites (e.g., Terra, Aqua, CloudSat, CALIPSO). As the name suggests, polar-orbiting satellites travel from pole to pole, allowing Earth to rotate beneath them. This movement enables the onboard sensors to rapidly collect data across the entire globe, inclusive of the polar regions.

Illustration of the A-train polar-orbiting satellites operated by NASA. (Credit: NASA)Medium-Earth orbit (approximately 2,000 to 35,500 km above Earth): this type of orbit is often used by the Global Positioning System (GPS) satellites.
High-Earth orbit (above 35,500 km above Earth): Satellites in this orbit are typically geostationary. They maintain a fixed position above a specific location on Earth’s surface. NOAA, for instance, operates two geostationary satellites that provide observations of the western hemisphere every five minutes and targeted observations of severe weather events every 30 seconds.

Satellite images of NOAA’s GOES-West (on the left) and GOES-East (on the right) full disk data on the day of summer solstice of 2022. (Credit: NOAA )
Section 1.3: Resolution#
Resolution plays a crucial role in determining how data from a sensor can be interpreted and utilized. This can vary depending on the design of the satellite’s sensor and its orbit. Four types of resolution are important to consider for any dataset—radiometric, spatial, spectral, and temporal.
Spatial resolution is defined as the area on Earth’s surface represented by each pixel within a remotely sensed image. Typically, a pixel representing a smaller area indicates a higher spatial resolution. The fine the resolution (the smaller the numerical value), the more detail can be discerned. In the image below, you can observe the difference in pixelation between a higher resolution 30 m/pixel image (left image), a medium resolution 100 m/pixel image (center image), and a coarser resolution 300 m/pixel image (right image).
|
|---|
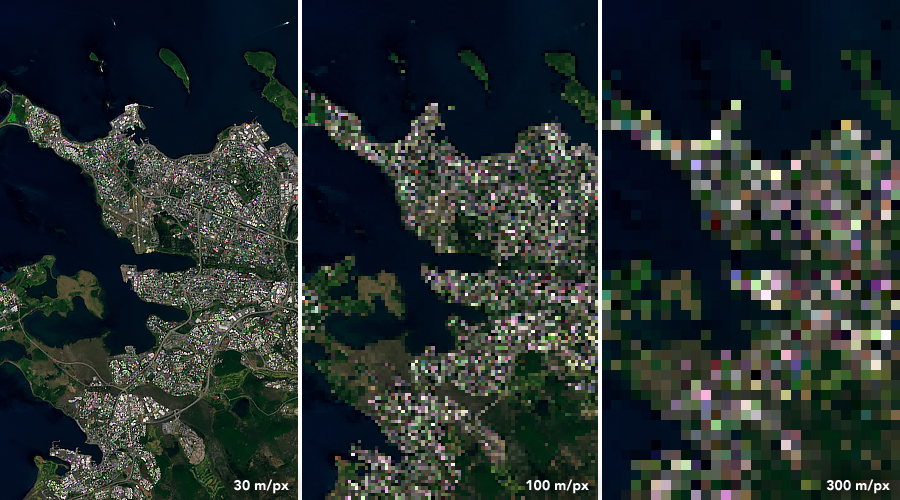
(Credit: NASA Earth Observatory)
Consequently, the spatial resolution of remotely sensed data imposes constraints on the types of applications for which the data can be utilized. For instance, it would likely be inappropriate to use the right image above to map local roads, whereas the left image might be suitable for such an application.
Temporal resolution, also frequently referred to as revisiting frequency, is the time it takes for a satellite to complete an orbit and revisit the same observation area. This parameter often depends on the satellite’s orbit, the characteristics of the sensor, and the sensor’s field of view from space.
For polar-orbiting satellites, temporal resolution can vary from 1 day to 16 days. The Moderate Resolution Imaging Spectroradiometer (MODIS, spatial resolution ranging from 250 m/pixel to 1 km/pixel depending on wavelength) flying onboard NASA’s Terra and Aqua satellite since 2000 has a temporal resolution of 1-2 days. Conversely, the Operational Land Imager (OLI, with a spatial resolution of 30 meter/pixel is featured on Landsat-8, a satellite jointly operated by NASA/USGS that has a narrower swath width and temporal resolution of 16 days.
Geostationary satellites maintain pace with Earth’s rotation, allowing them to provide sub-hourly temporal resolution for remotely sensed data. For instance, the latest generation of geostationary satellites offers a temporal resolution of 5-15 minutes, while their predecessors provided a resolution of 0.5-3 hours.
Spectral resolution represents a sensor’s capability to distinguish finer, or more and narrower, wavelengths. The more wavelengths a sensor can distinguish, the more information we can obtain and the more applications we can apply the data to. Typically, multispectral remote sensors feature 3-10 spectral bands, while hyperspectral sensors have hundreds of spectral bands, enabling us to scrutinize Earth’s objects in more detail.
For instance, the Airborne Visible/Infrared Imaging Spectrometer (AVIRIS) shown below records data in 224 spectral channels. These sensors enable us to differentiate between various rock and mineral types, vegetation types, water quality, and other features.
|
|---|
(Credit: NASA JPL)
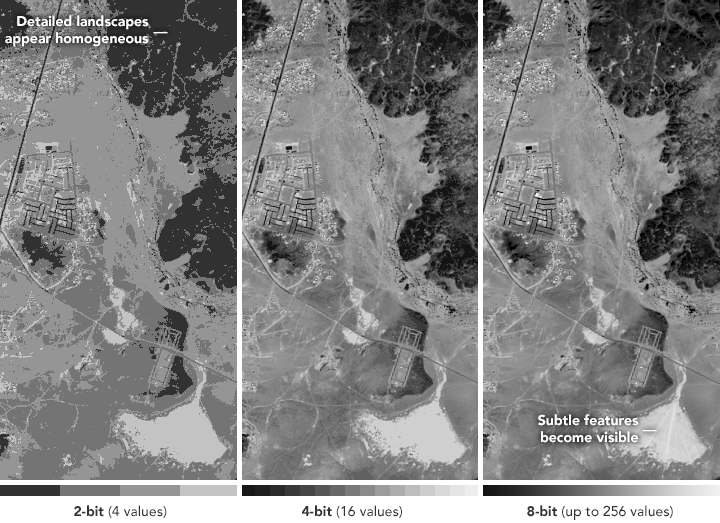
Radiometric resolution quantifies the amount of information contained in each pixel and is often expressed as the number of bits representing the recorded energy. Each bit records an exponent of power 2. For instance, an 8-bit resolution equals \(2^8\), implying that the sensor can utilize 256 potential digital values (0-255) to store information. The image below from NASA Earth Observatory illustrates how radiometric resolution affects the level of detail visible in remotely sensed data.
|
|---|
Credit: NASA
As illustrated in the image above, the higher the radiometric resolution (right image), the more values are available to store information, providing better discrimination between even the slightest differences in energy.
“Why can’t we have the sensor with the best resolution of all four categories?”
This is a great question! Due to technology limitations, it is very difficult to have the “perfect sensor”. If you’re aiming for high spatial resolution, there’s only a limited amount of energy in the area for that pixel. This implies that you’ll need a longer exposure to capture enough energy to extract meaningful information from that area. The longer the exposure, the less frequently you can revisit the same place. However, we can overcome this issue by using a constellation of satellites equipped with identical sensors to minimize the gaps between revisits. An example of this approach is the Sentinel-2 satellite pairs used by the European Space Agency.
Questions 1.3#
Now you have learned about four different types of resolution. Imagine a specific subject that you would like to study or monitor. It could be monitoring crop health, studying the impact of a landslide on a city, or any other topic of interest. Can you describe what type of remotely sensed data would be necessary for your project? Try to be specific - how often would you need the data (e.g., every few minutes, daily, weekly, etc.)? What would be the ideal spatial resolution for your purposes?
Hint: You can look at NASA’s Earthdata Data Pathfinders to see if you can find some inspirations.
# to_remove explanation

"""
To determine the best remotely sensed data for your application, you'd want to look for datasets that closely align with your spatial, temporal, spectral, and radiometric resolution needs. For instance, if we want to monitor tree health, we might consider using the following datasets: Moderate Resolution Imaging Spectroradiometer (MODIS) Vegetation Indices; Sentinel-2 Multispectral Instrument (MSI) data; Landsat 8 Operational Land Imager (OLI) and Thermal Infrared Sensor (TIRS) data; Soil Moisture Active Passive (SMAP).

""";
Section 2: Example Use Cases#
You’ve just completed a quick dive into the realm of satellite remote sensing and grasped some fundamental concepts. You might be wondering, “How can satellite data help answer some of my climate-related questions?”
To illuminate this, we’ll present six diverse examples of long-term satellite remote sensing data that track the dynamics of our land, ocean, and atmosphere. These animations are created using aggregated monthly satellite data, showcasing the fluidity of different Earth’s components. As we proceed, you’ll acquire computational skills to independently generate such animations.
These animations are all generated by NASA Earth Observatory using NASA satellite products. You can explore the dynamics of different components of the Earth system.
Section 2.1: Land/Cryosphere – Snow Coverage#
One of the most immediate effects of a warming planet is a reduction of snow coverage. Through long-term satellite data, we can accurately measure how the cryosphere has responded to changing temperature.
For instance, we can answer questions such as:
Are there fewer days in which a region is covered by snow during the winter?
Has the first day of snow coverage shifted for a specific region?
Has the maximum snow coverage for a given region experienced any changes?
The answers to these questions bear significant implications for local water availability, thereby influencing crucial areas such as agriculture, wildlife conservation, and energy consumption.
|
|---|

Credit: NASA
Section 2.2: Land/Terrestrial Ecology – Vegetation Health#
The global terrestrial ecosystem is highly regulated by the climatic conditions of different geographical regions. Long-term satellite data records allow us to map vegetation dynamics at relatively high spatial resolution (i.e., 1-5 km) frequently (i.e., daily to monthly). This data can help us answer questions about the impact of climate on ecosystems, both natural (e.g., forest and grassland) and human-modified (e.g., cropland) including:
Has the growing season of different ecosystems changed (e.g., lengthened or shortened) due to climate change?
What’s the impact of extreme events like drought, heatwave, wildfire, and flooding on different ecosystems?
How much carbon does the ecosystem store?
These applications have strong implications on communities through food security, culture activities, and other economic activities.
|
|---|

Credit: NASA
Section 2.3: Atmosphere – Cloud#
Clouds are one of the most complex proceses of the climate system. With long-term satellite data, different aspects of this critical component can be studied.
To study cloud processes, remotely sensed data can provide information about:
When and where do clouds exist in the atmosphere?
Physical properties of clouds (e.g., cloud height, cloud depth, cloud top temperature).
Microphysical properties of clouds (e.g., cloud partical sizes).
Clouds are one of the major sources of uncertainty in future climate projections. Satellite data is valuable to help us deepen our understanding of cloud processes to better incorporate the effects of clouds in climate models.
|
|---|

Cloud fraction, or the portion of a pixel covered by clouds. Credit: NASA
Section 2.4: Atmosphere – Rainfall#
In addition to temperature change, rainfall is another important aspect of climate change which has notable impacts on society and natural systems, for example through droughts and floods.
We can use remote sensing data to:
Quantify the variations in rainfall rates across different regions over time. This information can support water resource planning and management to meet the needs of local communities.
Investigate the frequency and potential causes of extreme rainfall events and examine their impacts on societal and natural systems. Examples include studying hurricanes and extreme rainfall events.
|
|---|

Credit: NASA
Section 2.5: Ocean – Sea Surface Temperature#
Given that over 70% of the Earth’s surface is covered by the ocean, the ocean plays a vital role in the functioning of the entire Earth system. Utilizing remotely sensed data, we can investigate changes in the physical ocean system and comprehend its impact on other interconnected systems.
Here are some key points regarding the significance of sea surface temperature (SST) in this context:
SST serves as a crucial indicator for monitoring global surface temperature changes. By analyzing SST data, we can gain insights into the overall warming or cooling trends of the Earth’s surface.
Monitoring SST is essential for studying large-scale ocean circulation and climate variability, such as the El Niño-Southern Oscillation (ENSO). Changes in SST patterns can provide valuable information about the occurrence and strength of ENSO events, which have significant impacts on global weather patterns.
SST plays a pivotal role in the study and prediction of tropical cyclones. Warm SST provides the necessary energy for the formation and intensification of tropical cyclones, making SST data critical for understanding and forecasting these powerful storm systems.
|
|---|

Credit: NASA
Section 2.6: Ocean/Marine Ecosystem – Chlorophyll#
Similar to terrestrial ecosystems, remotely sensed data can be harnessed to monitor and study marine ecosystems. Within these ecosystems, phytoplankton, a diverse group of microorganisms, play a critical role in marine food webs, thus significantly impacting marine ecosystems and various human activities, including fisheries.
Satellite data allows us to monitor changes in chlorophyll concentration, which serves as a proxy for the abundance of phytoplankton. This data enables exploration of important questions such as:
How have phytoplankton populations changed in response to shifting sea surface temperatures in different ocean basins?
By combining phytoplankton data with socioeconomic information, can we gain a comprehensive understanding of how the changing climate affects the fishing industry and the communities reliant on it.
|
|---|

Credit: NASA
Summary#
In this tutorial, you’ve explored the fundamental concepts of satellite remote sensing, equipping you with the knowledge to select appropriate remote sensing data for climate applications. Considerations such as spatial resolution and revisiting frequency were highlighted to ensure the optimal choice of data.
You also delved into the potential applications of satellite remote sensing for climate studies across land, ocean, and atmosphere. Specifically, you examined how satellite data can be utilized to monitor and analyze snow coverage, vegetation health, cloud, temperature changes, rainfall patterns, sea surface temperature, and phytoplankton abundance.
By understanding the capabilities and applications of satellite remote sensing, you are better equipped to leverage this technology for climate-related research, monitoring, and decision-making processes. This tutorial has laid the foundation for utilizing remote sensing data effectively in climate studies and emphasizes the vast potential it holds in advancing our understanding of Earth’s climate system.